Claude Code Mermaid diagrams and charts: the charts mod
🇫🇷FRRender Mermaid diagrams and vega-lite charts in Claude Code as real images, even inside AskUserQuestion. Open source mod, 60 ms to redraw a cached chart.
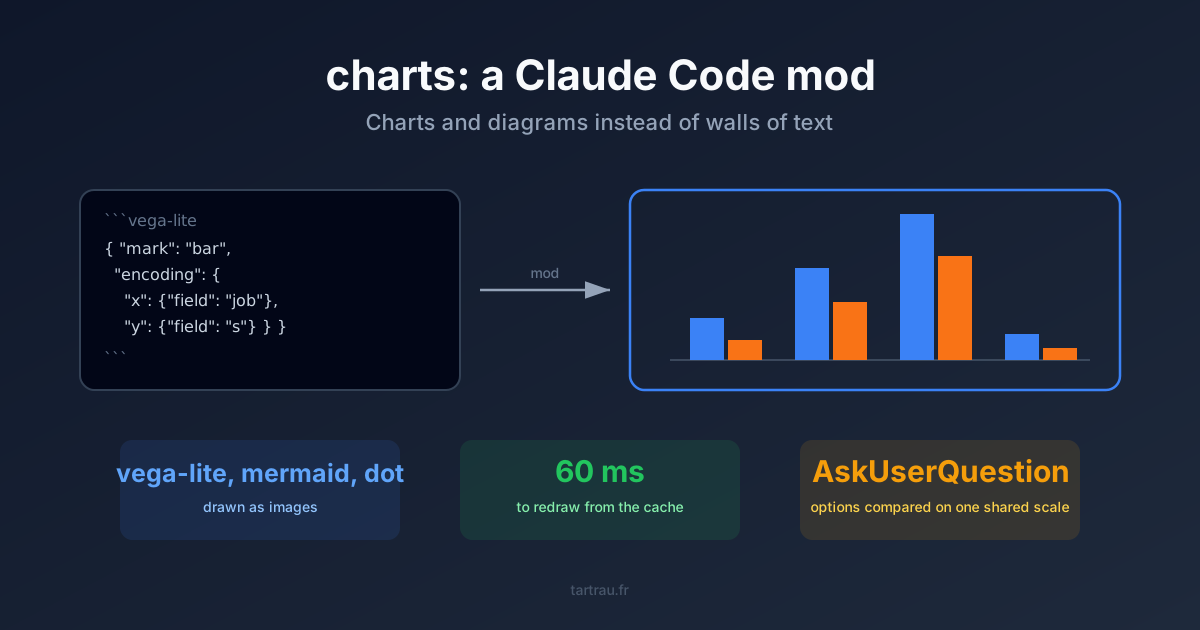
Claude Code answers in novels. A comparison between three options turns into six paragraphs, an architecture turns into ASCII art that drifts one column every other line. I got tired of reading those walls of text, so I wrote charts, an open source mod that shows charts and Mermaid diagrams in Claude Code instead of prose.
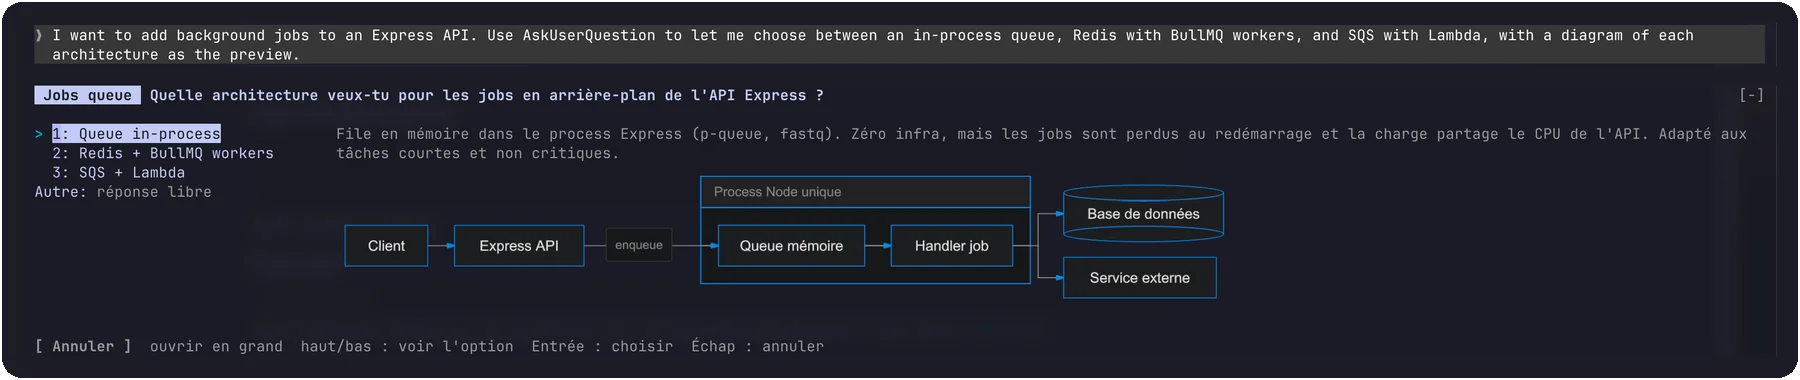
Claude writes a vega-lite, mermaid or dot block. The mod replaces it with an image in the terminal. The first render takes about 280 ms, a chart already drawn comes back in 60 ms. And when Claude asks a question with AskUserQuestion, each option can come with its own chart or diagram.
The problem: answers to read instead of answers to see
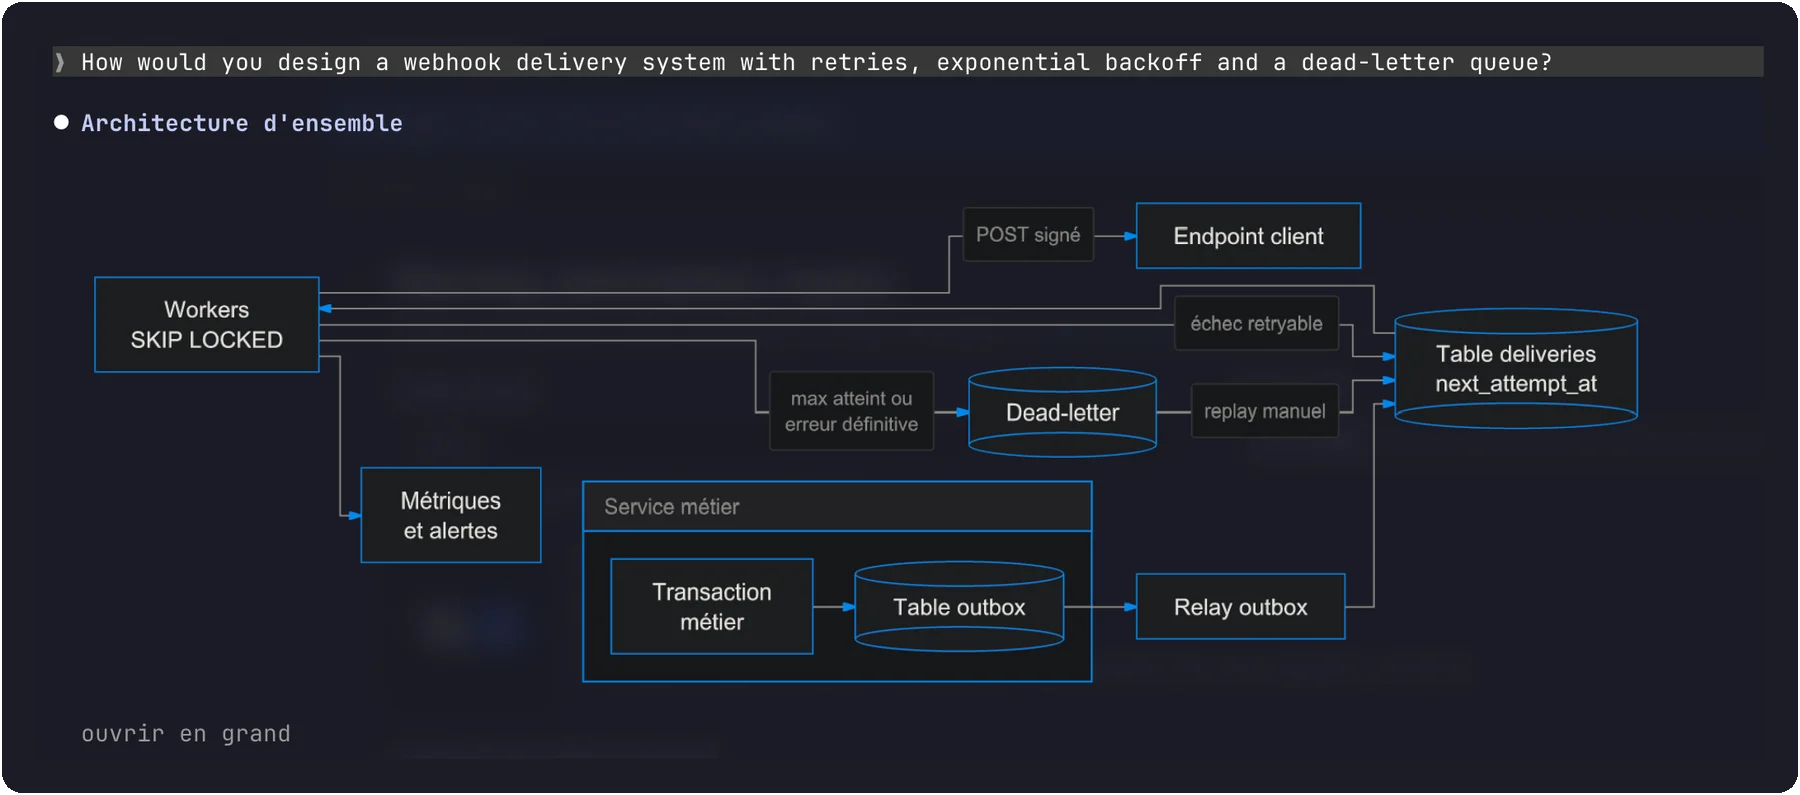
I often ask Claude questions whose answer is a number or a shape. “Was moving to self-hosted runners worth it?” calls for four pairs of durations. “How would you design a webhook delivery system with retries?” calls for a flow diagram.
Left alone, Claude answers with text: bullet lists of numbers, a table, sometimes ASCII art. The Claude Code terminal renders markdown, tables and syntax highlighting, but a mermaid block stays source code. The request has been open on Anthropic’s side since December 2025 (issue #14375): ASCII diagrams are misaligned and flat.
On this blog the number comes before the adjective. For a comparison, I wanted Claude to put the picture before the number.
What the mod does
charts is a mod: a plugin whose TypeScript code hooks into Claude Code’s events (mods documentation). It does three things.
1. It draws the blocks. Every vega-lite block becomes a chart, every mermaid or dot block becomes a diagram. Mermaid pie and gantt blocks are converted to Vega-Lite so they share the same theme. In the terminal, the image is a PNG shown through the kitty graphics protocol. In the desktop app, it is an SVG.
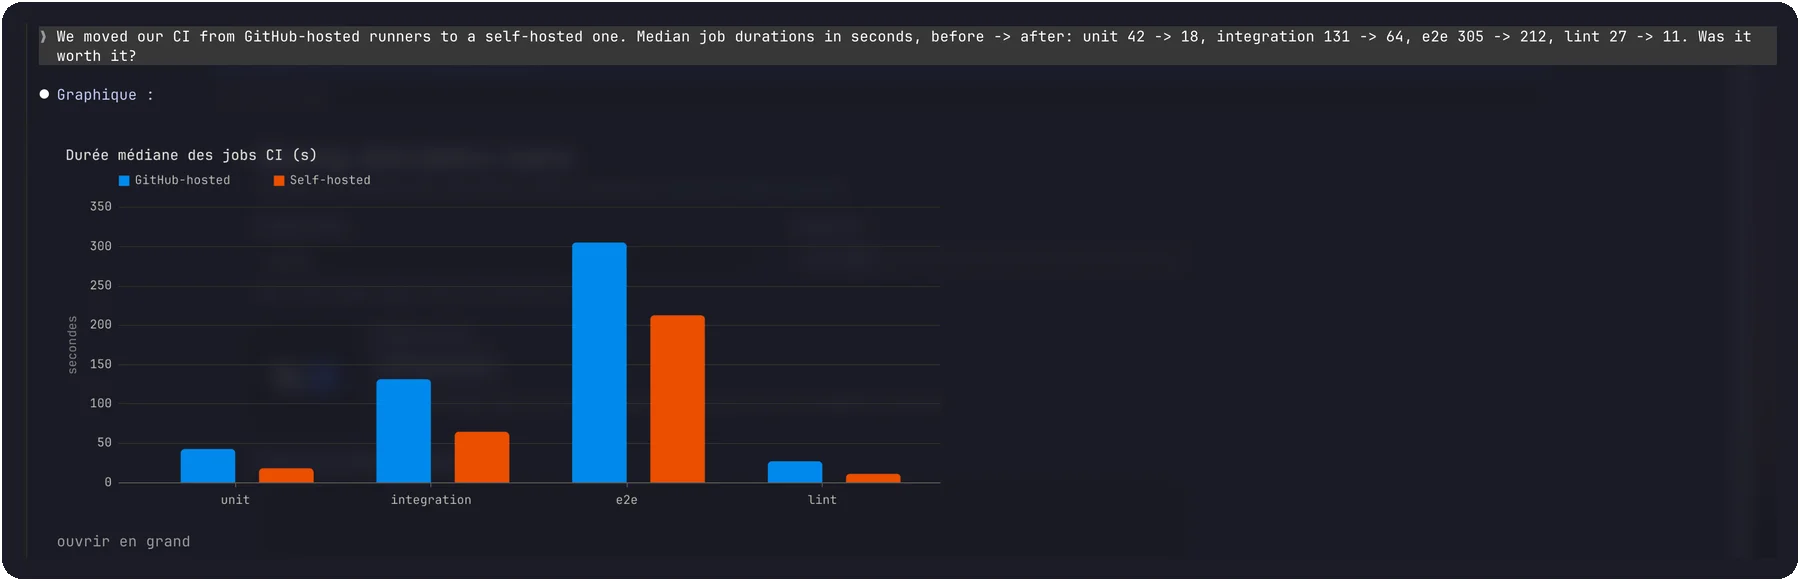
2. It nudges Claude to draw. A mod that can draw is useless if Claude never writes a vega-lite block. The mod adds a guide to the system prompt, covered below.
3. It replaces the AskUserQuestion dialog when the options carry charts or diagrams. The question shows above the prompt, with the image next to the options.
The stored message keeps the block’s source. Claude reads back the JSON data, not an image: no vision tokens, and nothing lost as the conversation goes on.
The guide that makes Claude draw
This is the part that took the most iterations. The guide is about 3,000 characters and tells Claude when to draw, what to draw and, above all, what to stop writing. An excerpt:
# Charts and diagrams by default
The person understands a picture faster than prose: show, then tell.
Do not wait to be asked for a chart or a diagram.

Add a vega-lite block, unprompted, whenever an answer holds any of:
two or more comparable quantities; a trend or anything over time;
a before/after; a distribution; a ranking.

Lead with the chart, then one or two sentences: the conclusion and the
one or two figures that matter. No table that repeats what the chart shows.

Use measured figures. When a value is an estimate, say so in the title
("estimation") and never present it as measured.
Three rules make the difference. “Show, then tell” puts the image at the top of the answer. “No table that repeats what the chart shows” removes the duplicate Claude adds by reflex. “Estimation” in the title stops Claude from dressing a guess up as a measurement, which is the real risk of a chart: it looks more certain than a sentence.
The guide also forbids colors, sizes and themes in specs. The mod applies its own: a chart written by Claude looks like every other one and fits the terminal width. Same logic as for Claude Code skills: a short, tested instruction beats an exhaustive one.
AskUserQuestion with charts on one shared scale
When Claude asks me to pick between three databases, each option has its preview. Three separate charts have a problem: each one computes its own y axis. A tall bar in option 1 and a tall bar in option 3 do not mean the same thing.
The mod merges the previews into a single Vega-Lite hconcat spec and forces shared scales:
export function combinedSpec(items: readonly OptionChart[], totalWidth: number, totalHeight: number) {
  const perWidth = Math.max(60, Math.floor(totalWidth / Math.max(1, items.length)) - AXIS_ROOM)
  const perHeight = Math.max(40, totalHeight - CHROME)
  return {
    hconcat: items.map(({ index, label, spec }) => {
      const { $schema: _schema, config: _config, width: _w, height: _h, title: _t, ...rest } = spec
      return { ...rest, title: `${index}. ${label}`, width: perWidth, height: perHeight }
    }),
    resolve: { scale: { x: 'shared', y: 'shared', color: 'shared' } },
    spacing: 16,
  }
}
One image, three panels, one axis. The bars are comparable at a glance again.
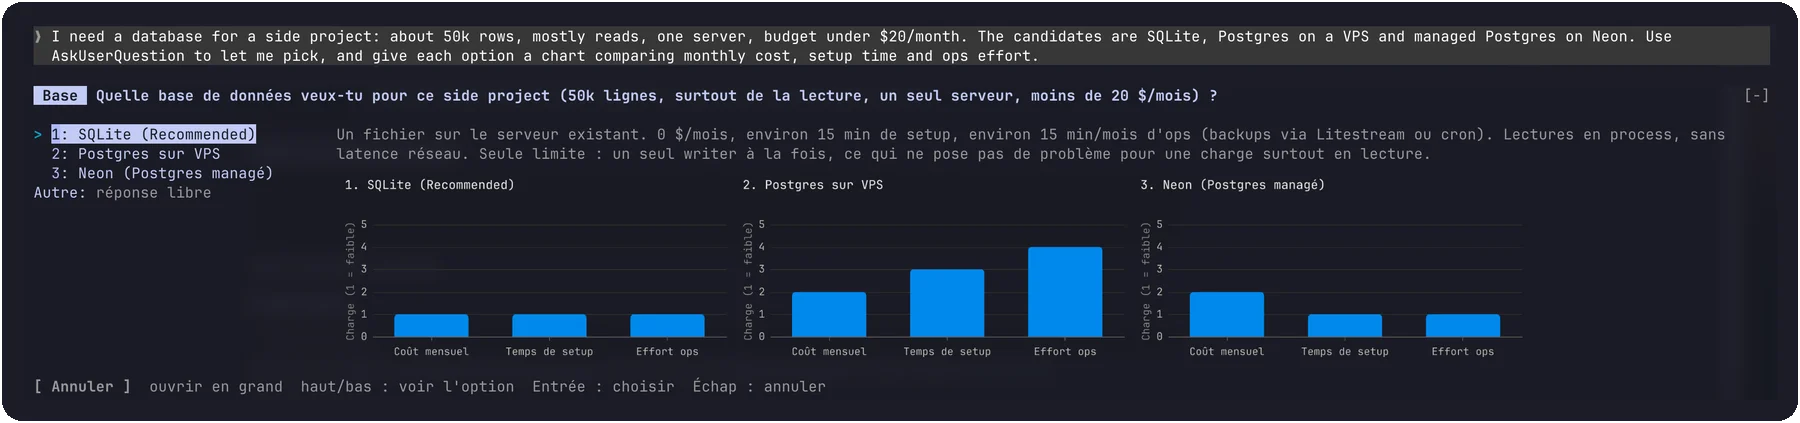
When the options are architectures rather than numbers, each option carries a Mermaid diagram. The image follows the option under the cursor: press down, the diagram changes.
How it works
The hooks module runs inside Claude Code, with neither Node nor a DOM. Vega and Graphviz need both. So the mod starts a small Node script per image, the renderer, built on Vega-Lite, beautiful-mermaid, Viz.js and resvg. It writes the PNG to ~/.cache/claude-charts, named after the spec’s hash. The terminal reads the file itself.
The ui.render hook splits each reply into text and chart segments, in order. Text goes back through Claude Code’s own renderer to keep the bullet and the styling. Images render in parallel, one process each. An invalid block comes back as source, with the error underneath.
The trickiest part is AskUserQuestion. A hook gets 10 seconds of its own time, and a human sometimes takes several minutes to choose. A $.process.run call in flight does not count against that budget. So the hook starts a sh that waits for a file:
const WAITER = ['/bin/sh', '-c', 'while [ ! -f "$1" ]; do sleep 0.1; done; cat "$1"; rm -f "$1"', 'charts-ask']The band above the prompt writes the answer to that file, the sh exits, and the hook hands the result back to Claude. If nothing comes after 30 waits of 10 minutes, the mod falls back to the original dialog. Escape or Ctrl+C cancel cleanly.
Measurements
I measured the renderer on an M4 Max Mac with Node 26: 15 renders per type, median of two runs, a fresh spec for the first render, then the same spec read back from the cache.
A chart already drawn comes back in 60 ms, 15 ms above a bare Node startup: the disk cache answers without loading Vega. Within a session it is even better: the mod keeps the last 64 renders in memory and starts no process at all when I scroll back. Graphviz, compiled to WebAssembly, is fast enough that the cache makes no difference.
The project is about 1,300 lines of TypeScript for the hooks, 420 lines for the renderer, and 95 tests (75 on the mod side with claude plugin test, 20 on the renderer side).
Install
You need Claude Code 2.1.280 or newer, Node 20 on your PATH, and for images in the terminal, a terminal with the kitty protocol, such as Ghostty or kitty. Other terminals show the chart’s text description.
Mods are still early access. Claude Code only loads them with this variable in ~/.claude/settings.json:
{
  "env": { "CLAUDE_CODE_ENABLE_FUNCTION_HOOKS": "1" }
}
Then:
claude plugin marketplace add https://gitlab.com/ThomasTartrau/charts.git
claude plugin install charts@tartrau-mods
There is nothing to call. Start a new session, ask a question with numbers in it, and Claude draws. The /charts command handles the rest: on or off, dark or light theme, maximum width and height in columns and rows, terminal cell ratio. Settings persist across sessions.
Alternatives
I am not the only one who had the idea. Two plugins cover part of the need:
- claude-mermaid draws Mermaid blocks with beautiful-mermaid, the same library charts uses for diagrams.
- claude-mermaid-terminal draws Mermaid as Unicode art. Real advantage: it works in any terminal, with no image protocol.
Both stop at Mermaid diagrams. charts adds Vega-Lite data charts, Graphviz, AskUserQuestion previews on a shared scale, and the guide that makes Claude draw without being asked. If your terminal cannot show images and you only care about diagrams, Unicode art is the right choice.
What I would change
One Node process per image. 280 ms on the first render is mostly Vega loading. A renderer that stays alive between images would remove that cost, at the price of one more process to babysit. I have not done it because the cache covers most redraws.
The guide costs tokens. About 700 tokens per session, estimated from its 3,000 characters. That is the price for Claude drawing without being asked. As with skills, nothing you add to the context is free. /charts off removes it.
An API still moving. Function hooks are early access and their API may change between Claude Code releases. The engine also limits what a mod can do: fewer than 12 rows around the AskUserQuestion dialog, and the band above the prompt only gets the keyboard after Ctrl+X Tab or a click.
The mod is MIT licensed on GitLab. It is part of my Claude Code setup, next to MCP RTK, which cuts the tokens of MCP servers.
Frequently asked questions
How do I show charts in Claude Code?
Install the charts mod (Claude Code 2.1.280 or newer, Node 20, CLAUDE_CODE_ENABLE_FUNCTION_HOOKS=1). Claude writes a vega-lite, mermaid or dot block and the mod replaces it with an image: a PNG in the terminal, an SVG in the desktop app.
Which terminals display the charts mod images?
Terminals that support the kitty graphics protocol, such as Ghostty and kitty. Other terminals show the chart's text description. The desktop app gets an SVG.
Does the charts mod use more tokens?
Images are never sent to the model: the stored message keeps the block's source, so Claude reads the data. The only cost is the guide added to the system prompt, about 700 tokens per session (estimated from its 3,000 characters).
How does AskUserQuestion work with the charts mod?
When each option carries a vega-lite chart, the mod merges them into one image with shared scales, so the bars become comparable. When the options are architectures, each one carries a mermaid diagram that shows when the option has focus.
How is charts different from claude-mermaid or mermaid-terminal?
Those plugins draw Mermaid, as an image or as Unicode art. charts adds Vega-Lite data charts, Graphviz, AskUserQuestion previews and a guide that makes Claude draw without being asked.